A few weeks ago, Ethan Hatcher mention on twitter that he would be interviewing Donald Rainwater, the Libertarian candidate for Governor of Indiana.
Some of the folks at WIBC, Ethan & Rob in particular, are ardently advocating for property tax reform. Rainwater has a made tax reduction his top issue; the first listed on his campaign site.
Here’s his Property Tax policy:
It’s very simple. The property tax will be 1% of the sale price each year. After 7% has been paid (7 years of payments) no more tax will be due.
Hatcher & I often go back and forth on Twitter. When he posted that Rainwater would be on his Saturday night show, I asked him to pose a question.
What would be the impact of Rainwater’s property tax policy? How would it impact small Hoosier towns & would any cease to exist?
Hatcher told me he would ask Rainwater this, and he’s a man of his word:
Rainwater responds by saying we should have a “real, serious conversation” about where property taxes are being spent today. He mentions that we, the citizens, should knock on the door and ask to see a transparent accounting of how our tax dollars are being spent.
Here is how Indiana property taxes are spent:
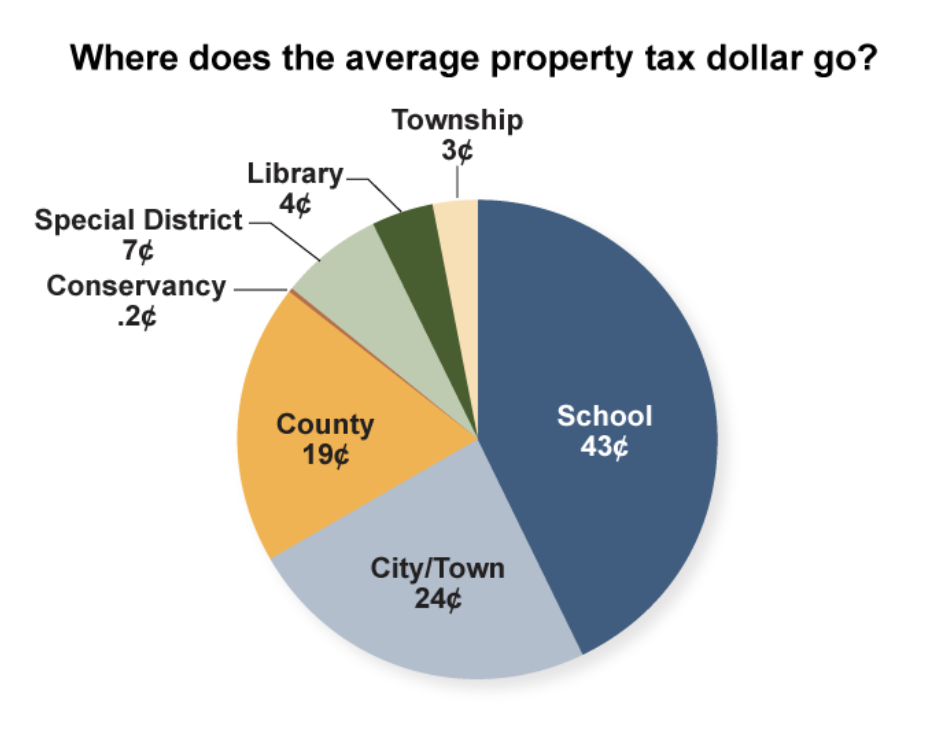
I found this chart on this website.
I was disappointed by Rainwater’s response. He seemed to not know that this information is publically available, or he’s just to lazy to do the work.
Data
The only data required to estimate the expected receipts of Rainwater’s property tax plan is real estate sales. With this information we can actually measure the exact amount of property tax brought in, so long as we have 7 years of data.
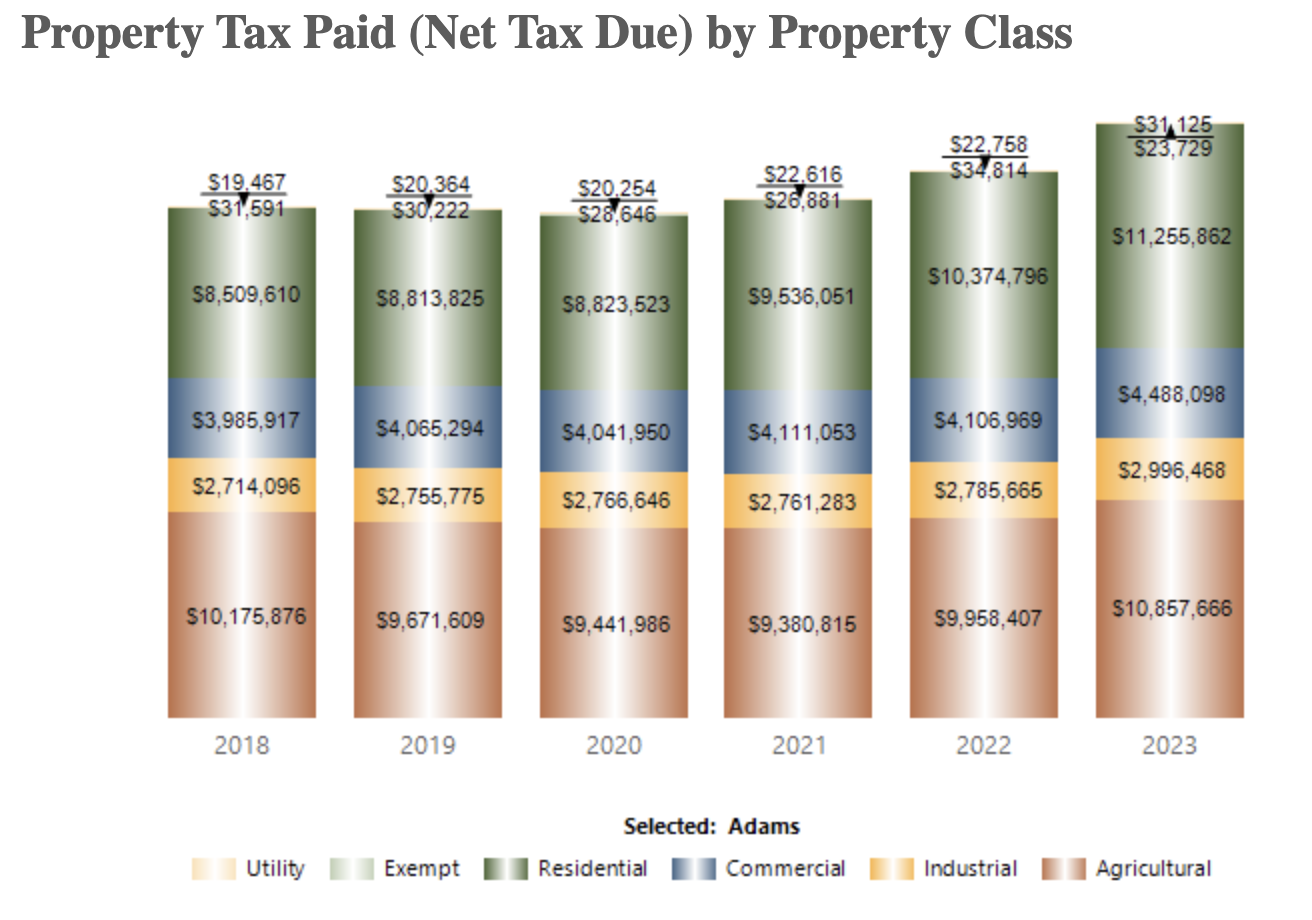
The initial place I looked was MLS (Zillow). The Indiana Association of Realtors has couple great resources. Unfortunately, these sources only include Residential property. And, depending on the county, ~50% or more of net due tax comes from Commercial, Industrial, and Aggricultural property. Here’s Adams county:
Thankfully, the folks at stats.indiana.edu collect & make available the data from each property sale in Indiana. Without them, this would not have been possible.
I grabbed the states property tax spending by county here. And the total county disbursements here.
I’ve made the code used to aggregate this data publically available, and will provide the data at request (because it was annoying to get).
Findings
I gathered all real estate sales in Indiana from 2017 to 2023. For each purchase I found 1% of the sale price. Here are the actual & estimated Property Tax Receipts for each county.
| County | Current Property Tax | RW. Plan Estimated Property Tax | % Change |
|---|---|---|---|
| Adams County, Indiana | 41,111,055 | 8,520,628 | -0.793 |
| Allen County, Indiana | 522,986,334 | 125,105,311 | -0.761 |
| Bartholomew County, Indiana | 125,343,940 | 30,887,747 | -0.754 |
| Benton County, Indiana | 18,552,178 | 4,960,155 | -0.733 |
| Blackford County, Indiana | 15,346,710 | 2,598,259 | -0.831 |
| Boone County, Indiana | 151,183,222 | 62,239,423 | -0.588 |
| Brown County, Indiana | 19,678,346 | 8,930,136 | -0.546 |
| Carroll County, Indiana | 19,098,593 | 5,805,385 | -0.696 |
| Cass County, Indiana | 48,273,434 | 6,724,549 | -0.861 |
| Clark County, Indiana | 166,975,459 | 45,261,908 | -0.729 |
| Clay County, Indiana | 18,697,349 | 4,823,049 | -0.742 |
| Clinton County, Indiana | 46,966,462 | 8,158,826 | -0.826 |
| Crawford County, Indiana | 10,437,302 | 2,108,653 | -0.798 |
| Daviess County, Indiana | 36,510,718 | 7,226,319 | -0.802 |
| Dearborn County, Indiana | 61,093,271 | 14,271,572 | -0.766 |
| Decatur County, Indiana | 30,024,592 | 8,168,355 | -0.728 |
| Dekalb County, Indiana | 57,276,702 | 13,070,699 | -0.772 |
| Delaware County, Indiana | 157,354,658 | 24,737,705 | -0.843 |
| Dubois County, Indiana | 58,616,687 | 9,988,765 | -0.830 |
| Elkhart County, Indiana | 317,412,667 | 61,541,120 | -0.806 |
| Fayette County, Indiana | 31,575,515 | 4,406,308 | -0.860 |
| Floyd County, Indiana | 84,754,840 | 30,573,855 | -0.639 |
| Fountain County, Indiana | 17,970,664 | 5,404,391 | -0.699 |
| Franklin County, Indiana | 21,061,848 | 6,178,527 | -0.707 |
| Fulton County, Indiana | 22,990,010 | 5,210,110 | -0.773 |
| Gibson County, Indiana | 53,048,008 | 8,695,162 | -0.836 |
| Grant County, Indiana | 77,512,719 | 11,788,996 | -0.848 |
| Greene County, Indiana | 26,116,637 | 6,273,618 | -0.760 |
| Hamilton County, Indiana | 703,960,175 | 242,032,052 | -0.656 |
| Hancock County, Indiana | 113,213,104 | 45,376,426 | -0.599 |
| Harrison County, Indiana | 29,326,160 | 10,323,232 | -0.648 |
| Hendricks County, Indiana | 304,331,782 | 99,295,411 | -0.674 |
| Henry County, Indiana | 53,951,111 | 10,679,081 | -0.802 |
| Howard County, Indiana | 150,888,833 | 22,933,239 | -0.848 |
| Huntington County, Indiana | 45,731,009 | 9,360,299 | -0.795 |
| Jackson County, Indiana | 50,924,262 | 11,452,910 | -0.775 |
| Jasper County, Indiana | 36,374,636 | 12,188,761 | -0.665 |
| Jay County, Indiana | 27,576,260 | 4,702,160 | -0.829 |
| Jefferson County, Indiana | 37,160,244 | 8,454,551 | -0.772 |
| Jennings County, Indiana | 23,180,350 | 5,096,325 | -0.780 |
| Johnson County, Indiana | 231,941,506 | 69,028,242 | -0.702 |
| Knox County, Indiana | 49,142,708 | 6,081,792 | -0.876 |
| Kosciusko County, Indiana | 107,447,277 | 33,709,968 | -0.686 |
| Lagrange County, Indiana | 35,380,262 | 15,453,990 | -0.563 |
| Lake County, Indiana | 1,036,505,202 | 136,507,682 | -0.868 |
| Laporte County, Indiana | 166,265,302 | 32,199,631 | -0.806 |
| Lawrence County, Indiana | 47,091,125 | 10,682,957 | -0.773 |
| Madison County, Indiana | 164,965,945 | 29,017,446 | -0.824 |
| Marion County, Indiana | 1,568,271,540 | 369,802,400 | -0.764 |
| Marshall County, Indiana | 60,988,935 | 15,198,400 | -0.751 |
| Martin County, Indiana | 8,311,929 | 1,841,228 | -0.778 |
| Miami County, Indiana | 34,163,618 | 5,574,905 | -0.837 |
| Monroe County, Indiana | 177,992,289 | 51,471,997 | -0.711 |
| Montgomery County, Indiana | 57,192,328 | 10,020,485 | -0.825 |
| Morgan County, Indiana | 74,231,824 | 27,635,096 | -0.628 |
| Newton County, Indiana | 21,548,645 | 5,563,620 | -0.742 |
| Noble County, Indiana | 51,961,513 | 13,464,620 | -0.741 |
| Ohio County, Indiana | 4,803,528 | 1,535,470 | -0.680 |
| Orange County, Indiana | 16,496,863 | 3,522,701 | -0.786 |
| Owen County, Indiana | 17,251,174 | 5,813,873 | -0.663 |
| Parke County, Indiana | 14,331,421 | 4,309,576 | -0.699 |
| Perry County, Indiana | 17,681,867 | 3,391,953 | -0.808 |
| Pike County, Indiana | 19,420,354 | 2,472,025 | -0.873 |
| Porter County, Indiana | 264,163,466 | 71,805,795 | -0.728 |
| Posey County, Indiana | 42,856,637 | 5,994,787 | -0.860 |
| Pulaski County, Indiana | 14,142,812 | 3,290,218 | -0.767 |
| Putnam County, Indiana | 35,710,275 | 11,592,272 | -0.675 |
| Randolph County, Indiana | 32,139,703 | 5,583,437 | -0.826 |
| Ripley County, Indiana | 25,297,427 | 7,447,408 | -0.706 |
| Rush County, Indiana | 24,579,085 | 4,879,782 | -0.801 |
| St. Joseph County, Indiana | 436,429,433 | 77,894,209 | -0.822 |
| Scott County, Indiana | 20,804,128 | 5,265,628 | -0.747 |
| Shelby County, Indiana | 55,312,056 | 13,231,946 | -0.761 |
| Spencer County, Indiana | 28,313,291 | 4,401,541 | -0.845 |
| Starke County, Indiana | 24,454,138 | 6,092,616 | -0.751 |
| Steuben County, Indiana | 49,682,157 | 15,572,509 | -0.687 |
| Sullivan County, Indiana | 25,077,022 | 3,279,084 | -0.869 |
| Switzerland County, Indiana | 7,809,953 | 2,685,460 | -0.656 |
| Tippecanoe County, Indiana | 206,012,188 | 62,954,242 | -0.694 |
| Tipton County, Indiana | 22,581,446 | 4,730,845 | -0.790 |
| Union County, Indiana | 9,033,103 | 2,247,088 | -0.751 |
| Vanderburgh County, Indiana | 256,165,336 | 54,932,200 | -0.786 |
| Vermillion County, Indiana | 21,803,103 | 3,119,054 | -0.857 |
| Vigo County, Indiana | 146,525,294 | 20,988,656 | -0.857 |
| Wabash County, Indiana | 33,109,907 | 7,748,525 | -0.766 |
| Warren County, Indiana | 13,616,807 | 2,131,752 | -0.843 |
| Warrick County, Indiana | 67,465,732 | 25,447,305 | -0.623 |
| Washington County, Indiana | 26,814,958 | 5,977,738 | -0.777 |
| Wayne County, Indiana | 89,583,705 | 14,620,912 | -0.837 |
| Wells County, Indiana | 28,437,374 | 9,144,116 | -0.678 |
| White County, Indiana | 33,671,859 | 8,409,882 | -0.750 |
| Whitley County, Indiana | 37,501,419 | 10,698,901 | -0.715 |
We can see that half of counties would see their property tax receipts reduced by 75%. No county would retain 50% of their current receipts.
Percent Change Summary
   Min. 1st Qu.  Median    Mean 3rd Qu.    Max.
-0.8762 -0.8243 -0.7669 -0.7585 -0.7048 -0.5462
Let’s look at the top 5. Under Rainwater’s suggested plan, Knox & Pike county will see a nearly ~90% drop in property tax.
| County | Current Property Tax | RW. Plan Estimated Property Tax | Delta | % Change |
|---|---|---|---|---|
| Knox County, Indiana | 49,142,708 | 6,081,792 | -43,060,916 | -0.876 |
| Pike County, Indiana | 19,420,354 | 2,472,025 | -16,948,329 | -0.873 |
| Sullivan County, Indiana | 25,077,022 | 3,279,084 | -21,797,938 | -0.869 |
| Lake County, Indiana | 1,036,505,202 | 136,507,682 | -899,997,520 | -0.868 |
| Cass County, Indiana | 48,273,434 | 6,724,549 | -41,548,885 | -0.861 |
Most of western counties will see a ~80-90% drop in property tax receipts.
Code
# here's how I created the plots.
pal <- colorNumeric(
  palette = "OrRd",
  reverse=T,
  domain = spatial_data$delta_perc,
)

leaflet() |>
    addProviderTiles(providers$CartoDB.Positron) |>
     addPolygons(data = spatial_data,
              color = ~pal(delta_perc),
              weight = 0.8,
              smoothFactor = 0.1,
              fillOpacity = 0.5,
              label = ~paste0( NAME,': ', paste0(round(delta_perc,3)*100,'%'))
    ) |>
    setView(lng = -86.148,lat = 39.7691, zoom = 6.5) |>
  addLegend(
    position = "bottomright",
    pal = pal,
    values = spatial_data$delta_perc,
    title = "% Reduction"
  )
What if counties completely stopped spending on debt/interest & economic development? Would that cover the loss in funding created by Rainwater’s plan?
No.
Economic Spending / R.W. Delta
This is the delta created by Rainwater’s plan divided by the county’s total disbursements for debt service/interest & economic development.
   Min. 1st Qu.  Median    Mean 3rd Qu.    Max.
 0.5982  3.7316  5.8120  7.6953  8.6645 57.0593
Half of Hoosier counties would need to spend ~500% more economic development & investment dollars to warrant Rainwater’s cut. Every county1, except for Newton, would not be able to make up for the loss in receipts.
A quarter of Hoosier counties would have to reduce their total spending by ~20% or more.
Total Disbursements % Change
   Min. 1st Qu.  Median    Mean 3rd Qu.    Max.
0.04371 0.12644 0.16246 0.16630 0.19341 0.38890
Howard, Lake, & Bartholomew Counties would need to reduce their total disbursments by 1/3.
Summary
Rainwater’s plan will require large cuts to social spending. Nearly every county will see their property tax receipts reduced by 70-80%. The plurality of property taxes are spent on school, around 40%.
Reducing “Economic Development” spending cannot fill the gap created by Rainwater’s proposed policy. The amount counties spend on debt service/interest & economic development is far less than the gap created.
It is now undeniable that schools, police, fire, roads, infrastructure spending will have to be cut. What will it be?
Footnotes
No 2023 data for Owens, Franklin, and Vermillion↩︎